Text & everyday tools · QR & Barcode Toolkit
QR code error correction levels L, M, Q and H explained
· How it works
qr-code error-correction printing
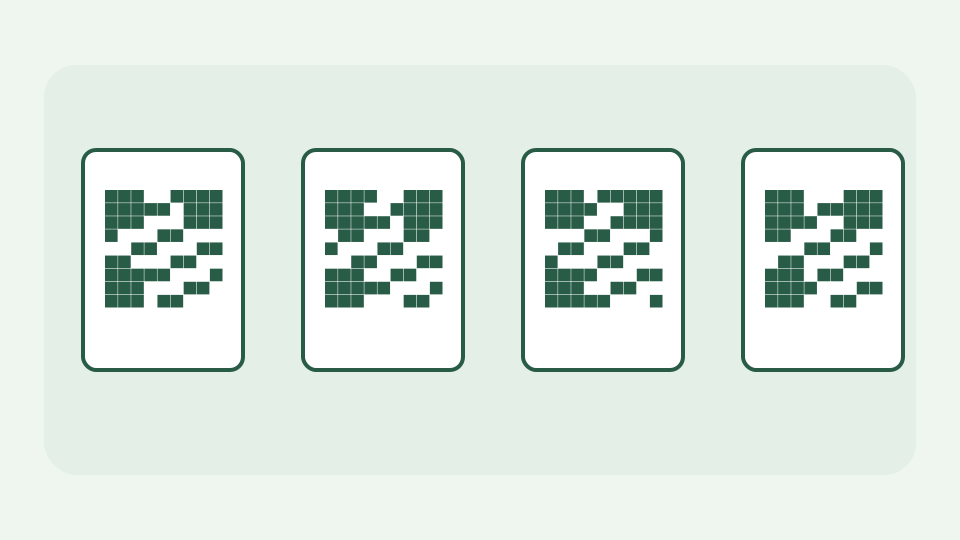
Explains what the four error correction levels actually promise, how Reed–Solomon recovery works in plain terms, and how to choose a level for print, screens and damaged surfaces.
The poster that scanned in the office and failed outdoors — how scratches, glare and overprinted logos eat into a code's redundancy
A poster may scan flawlessly on a monitor yet fail once printed behind glass or outdoors. Smudges, scratches, glare and an overlaid logo can make parts of a QR grid unreadable. A higher recovery setting adds redundancy but does not repair poor contrast or tiny printed squares. For a marketing manager approving a run of posters, the right test is the final material at the final viewing distance, not a screenshot zoomed in on a desktop.
What L, M, Q and H mean — the approximate share of codewords each level can restore, and why the numbers are ceilings not guarantees
QR error-correction levels L, M, Q and H are commonly described as recovering roughly 7%, 15%, 25% and 30% of codewords respectively. Those percentages are useful orientation, not a guarantee that you may hide 30% of any arbitrary square or cover a finder pattern. The actual recovery depends on which codewords are damaged and whether the phone can locate the grid in the first place. ToolAcre lets you select the level explicitly and shows the generated result before export.
Reed–Solomon in one paragraph — how spare codewords let a reader reconstruct missing data blocks
Reed–Solomon encoding computes additional check codewords from the data. When a scanner reads a partly damaged symbol, enough surviving codewords let it reconstruct missing or incorrect ones. The QR encoder also interleaves data across the grid, making a local blemish less likely to wipe out a whole contiguous message. That mechanism is separate from the large squares at the corners: those function patterns orient the scanner and are not a free area for decorative artwork.
The trade-off — why a higher level grows the grid or shrinks the modules, and what that does to scan distance
A higher recovery level spends capacity on parity. To encode the same text, it may need a larger QR version with more modules, or it may keep the same grid while leaving less spare space. If you print the larger grid in the same physical rectangle, each module becomes smaller and harder to resolve from a distance. A level H code is therefore not automatically more scannable than level M: image size, quiet zone and contrast have to remain adequate.
Choosing a level by situation — glossy print, laminated badges, screens, engraved metal, and codes with artwork on top
For a clean, high-contrast screen, level M is a sensible starting point. A code on an engraved surface or worn badge may need more recovery and a larger physical size; glossy paper adds reflection that error correction alone cannot solve. A logo should avoid finder/timing regions and leave enough data unobscured, followed by actual scan tests. The best setting is the least dense grid that survives the damage your audience will realistically encounter, not the highest letter by habit.
Worked example: compare four grid sizes and test a small data-area blemish
Using the exact URL https://example.com/menu in ToolAcre’s byte-mode QR encoder, both L and M produce a 25×25 module grid, while Q and H produce 29×29. This is a measured result for that input, not a rule for all URLs: a longer address may cross a version boundary at a different level. Generate four files, keep the physical width the same, and compare module size. Then cover a small data area in a disposable print and scan with multiple phones; covering a corner finder pattern tests orientation failure, not Reed–Solomon capacity.
What this does not cover — decoder differences between phone cameras, and non-QR symbologies such as Data Matrix
Error correction cannot promise that every camera, screen reader or printing process will decode an awkward symbol. A code set in a tiny label with low-contrast colours may fail with every recovery level. This article covers QR codes, not Code 128 linear barcodes or Data Matrix; their encoders and recovery rules differ. A successful scan also says nothing about the trustworthiness or future availability of the URL the code opens.
The takeaway — decide the level from the surface the code will live on, then generate the code in the QR & Barcode Toolkit and test it
Choose the level from the surface and likely damage, then size the modules and preserve a quiet zone. QR & Barcode Toolkit uses a QR encoder to build the grid on your device; your typed value is not uploaded to a code-generation server. Export a sample, print it at final dimensions and test before approving hundreds of copies.